Thursday, March 22, 2018

Easily testing the latest version of GDAL

GDAL is one of the cornerstones of the open source geospatial stack (and actually of many of the proprietary systems as well).
If you want to use or test the latest features this can be done quite easily by setting a few environment variables:

I save this commands in a file new_gdal.sh. After running

source new_gdal.sh

You will be able to use all the latest gdal tools. 


johan@x1:~$ source ~/latest_gdal.sh 
johan@x1:~$ gdalinfo --version
GDAL 2.3.0dev, released 2017/99/99


Actually if you use this command, also tools dynamically linked to gdal will be using this latest version.

johan@x1:~$ saga_cmd io_gdal
____________________________

   #####   ##   #####    ##
  ###     ###  ##       ###
   ###   # ## ##  #### # ##
    ### ##### ##    # #####
 ##### #   ##  ##### #   ##
____________________________

SAGA Version: 6.4.0


Library: GDAL/OGR
Category: Import/Export
File: /usr/local/lib/saga/libio_gdal.so
Description:
Interface to Frank Warmerdam's Geospatial Data Abstraction Library (GDAL).
Version 2.3.0dev

Note that this will work well for packages dynamically linked to the C api. If packages are linked to the C++ api, they may need recompilation.

If you are on windows, you could have a look at SDKShell.bat (part of the builds from Tamas Szekeres).

Note: I actually wrote this blogpost because in his presentation on FOSDEM Jeremy Mayeres recommended using Docker for using the latest version of GDAL. I think that solution is overkill for desktop usage, and using environment variables is easier.
Wednesday, March 7, 2018

Don't use zonal statistics as a table in ArcGIS

Short version: Don't ever use zonal statistics as a table in arcgis. It manages to do simple calculations such as calculating an average wrong.

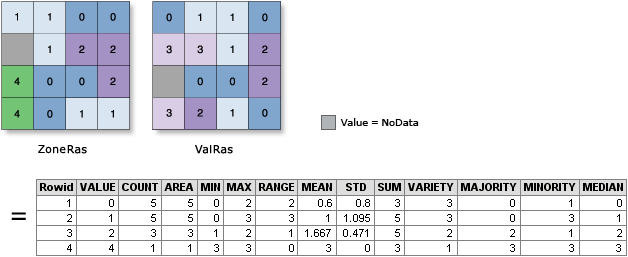
Example of using zonal statistics between grid cells (from the ArcGIS manual)


Long version: I was hired by a customer to determine why they got unexpected results for their analyses. These analyses led to an official map with legal consequences. After investigating their whole procedure a number of issues were found. But the major source of errors was one which I found very unlikely: it turns out that the algorithm used by ArcGIS spatial analyst to determine the average grid value in a shape is wrong. Not just a little wrong. Very wrong. And no, I am not talking about the no data handling which was very wrong as well, I'm talking about how the algorithm compares vectors and rasters Interestingly, this seems to be known, as the arcgis manual states
It is recommended to only use rasters as the zone input, as it offers you greater control over the vector-to-raster conversion. This will help ensure you consistently get the expected results.
So how does arcgis compare vectors and rasters? In fact one could invent a number of algorithms:

  • Use the centers of the pixels and compare those to the vectors (most frequently used and fastest).
  • Use the actual area of the pixels 
  • Use those pixels of which the majority of the area is covered by the vector. 


None of these algorithm matches with the results we saw from arcgis, even though the documentation seems to suggest the first method is used. So what is happening? It seems that arcgis first converts your vector file to a raster, not necessarily in the same grid system as the grid you compare to. Then it interpolates your own grid (using an undocumented method) and then takes the average of those interpolated values if their cells match with the raster you supplied. This means pixels outside your shape can have an influence on the result. This mainly seems to occur when large areas are mapped (eg Belgium at 5m).

The average of this triangle is calculated by ArcGIS as 5.47


I don't understand how the market leader in GIS can do such a basic operation so wrong, and the whole search also convinced me how important it is to open the source (or at least the algorithm used) to get reproducible results. Anyway, if you are still stuck with arcgis, know that you can install SAGA GIS as a toolbox. It contains sensible algorithms to do a vector/raster intersection and they are also approximately 10 times faster than the ArcGIS versions. Or you can have a look at how Grass and QGIS implement this.  All of this of course only if you consistently want to get the expected results...

And if your government also uses ArcGIS for determining taxes or other policies, perhaps they too should consider switching to a product which consistently gives the expected results.

Update March 18 2018: make sure you check out the comments from Steve Kopp (spatial analyst development team) below and the discussion - it is interesting.