Thursday, March 22, 2018

Easily testing the latest version of GDAL

GDAL is one of the cornerstones of the open source geospatial stack (and actually of many of the proprietary systems as well).
If you want to use or test the latest features this can be done quite easily by setting a few environment variables:

I save this commands in a file new_gdal.sh. After running

source new_gdal.sh

You will be able to use all the latest gdal tools. 


johan@x1:~$ source ~/latest_gdal.sh 
johan@x1:~$ gdalinfo --version
GDAL 2.3.0dev, released 2017/99/99


Actually if you use this command, also tools dynamically linked to gdal will be using this latest version.

johan@x1:~$ saga_cmd io_gdal
____________________________

   #####   ##   #####    ##
  ###     ###  ##       ###
   ###   # ## ##  #### # ##
    ### ##### ##    # #####
 ##### #   ##  ##### #   ##
____________________________

SAGA Version: 6.4.0


Library: GDAL/OGR
Category: Import/Export
File: /usr/local/lib/saga/libio_gdal.so
Description:
Interface to Frank Warmerdam's Geospatial Data Abstraction Library (GDAL).
Version 2.3.0dev

Note that this will work well for packages dynamically linked to the C api. If packages are linked to the C++ api, they may need recompilation.

If you are on windows, you could have a look at SDKShell.bat (part of the builds from Tamas Szekeres).

Note: I actually wrote this blogpost because in his presentation on FOSDEM Jeremy Mayeres recommended using Docker for using the latest version of GDAL. I think that solution is overkill for desktop usage, and using environment variables is easier.

Wednesday, March 7, 2018

Don't use zonal statistics as a table in ArcGIS

Short version: Don't ever use zonal statistics as a table in arcgis. It manages to do simple calculations such as calculating an average wrong.

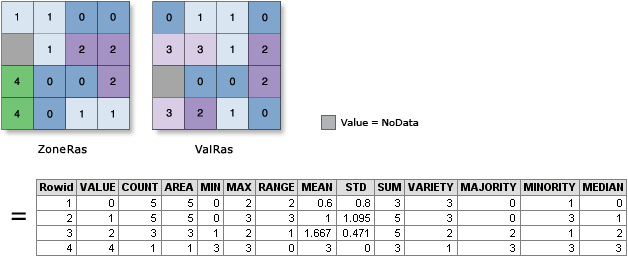
Example of using zonal statistics between grid cells (from the ArcGIS manual)


Long version: I was hired by a customer to determine why they got unexpected results for their analyses. These analyses led to an official map with legal consequences. After investigating their whole procedure a number of issues were found. But the major source of errors was one which I found very unlikely: it turns out that the algorithm used by ArcGIS spatial analyst to determine the average grid value in a shape is wrong. Not just a little wrong. Very wrong. And no, I am not talking about the no data handling which was very wrong as well, I'm talking about how the algorithm compares vectors and rasters Interestingly, this seems to be known, as the arcgis manual states
It is recommended to only use rasters as the zone input, as it offers you greater control over the vector-to-raster conversion. This will help ensure you consistently get the expected results.
So how does arcgis compare vectors and rasters? In fact one could invent a number of algorithms:

  • Use the centers of the pixels and compare those to the vectors (most frequently used and fastest).
  • Use the actual area of the pixels 
  • Use those pixels of which the majority of the area is covered by the vector. 


None of these algorithm matches with the results we saw from arcgis, even though the documentation seems to suggest the first method is used. So what is happening? It seems that arcgis first converts your vector file to a raster, not necessarily in the same grid system as the grid you compare to. Then it interpolates your own grid (using an undocumented method) and then takes the average of those interpolated values if their cells match with the raster you supplied. This means pixels outside your shape can have an influence on the result. This mainly seems to occur when large areas are mapped (eg Belgium at 5m).

The average of this triangle is calculated by ArcGIS as 5.47


I don't understand how the market leader in GIS can do such a basic operation so wrong, and the whole search also convinced me how important it is to open the source (or at least the algorithm used) to get reproducible results. Anyway, if you are still stuck with arcgis, know that you can install SAGA GIS as a toolbox. It contains sensible algorithms to do a vector/raster intersection and they are also approximately 10 times faster than the ArcGIS versions. Or you can have a look at how Grass and QGIS implement this.  All of this of course only if you consistently want to get the expected results...

And if your government also uses ArcGIS for determining taxes or other policies, perhaps they too should consider switching to a product which consistently gives the expected results.

Update March 18 2018: make sure you check out the comments from Steve Kopp (spatial analyst development team) below and the discussion - it is interesting.

Sunday, November 6, 2016

Computer generated paraph

While generating some random test data with some unique properties (all positive, highly autocorrelated, uniform distributed) I accidently bumped on a nice way to generate paraphs using R.


Try yourself in R:

Thursday, September 15, 2016

Foss4g.be - The Belgian conference on open-source geospatial software

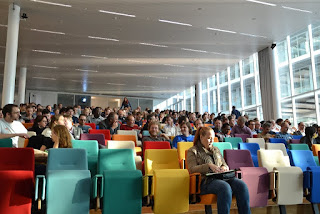
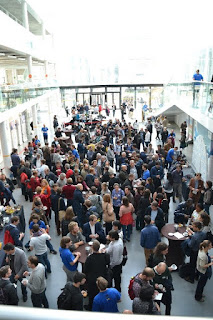
Next week, the second edition of Foss4g.be, the Belgian conference on open-source geospatial software will take place in Tour and Taxis in Brussels.

The conference will bring together developers and users of open source geomatics software from Belgium and all over the world. Participation is free of charge but registration is required.

We have a varied program for you: in the plenary session we will present the current state of many of the major Open source GIS applications - this includes novelties demonstrated at the last FOSS4G conference in Bonn.

Next in the main track the different regions of Belgium will present their open (geo) data sets. Moreover Christian Quest from Open StreetMap France will explain how the Openstreetmap community was actually part of the creation and maintenance of the address database in France.

In our parallel sessions we have presentations covering all aspects of Open source geospatial. Presentations on the usage of some of the most widely used programs, such as QGis, Openlayers3 and PostGIS, but also less well known solutions for handling 3D data, building SDI and doing advanced analyses. With the open streetmap conference happening just the day after this conference, we also have a special track with specialised

Last but not least, conferences are all about meeting networking and meeting new people, and you will get the chance to do so during our breaks!

Hope to see many of you in Brussels!

http://2016.foss4g.be

Thursday, September 8, 2016

In September, Brussels turns into Maptember

In two weeks from now, from 22 september until 26 september 5 big events from the open geo movement will be happening in Brussels.


On 22 september there will be two conferences: one FOSS4G Belgium conference organised by the local , which focuses on software for Geo. There will also be a lot of attention to open (geo) data sets provided by different governement agencies in Belgium.


On the same day in a different location the Humanitarian OpenStreetMap Team will also be gathering for their HOT summit. After both events, forces will be joined for a mapathon.

The next three days the international openstreetmap conference will be happening at VUB.
State Of The Map

Last but not least on Monday after all events, there will be a hackday, focused on OSM and OSGeo technologies.

Completely lost track? Check
http://maptember.brussels/ for an overview.

Monday, April 11, 2016

OSGeo.be presents: GeoDevEvening webmapping and OpenLayers 3

Next monday, OSGeo.be will be organising their first GeoDevEvening. The theme will be webmapping and especially Openlayers 3. There will be two speakers, Pierre Marchand of Atelier Cartographique wil give an overview of Webmapping tools. Later we will take a deeper dive with Thomas Gratier, one of the authors of the OpenLayers 3 Beginners guide.

OpenLayers 3 is a JavaScript based library for web mapping, published under BSD license. It groups a set of functionalities to create both lightweight web mapping applications and more heavy web mapping applications for advanced usages. It enables display of geographic features (markers, lines, polygons) with custom styles, most of the time with background maps services from various sources (including OpenStreetMap). It manages all interactions to select, draw geographic entities, display, measure geographic coordinates and manage different Earth representations using cartographic projections.

The event will happen at  BEL in Brussels (those who were at FOSS4G.be will remember the place), next monday 18 april at 19:00 until 22:00.  The event is free. You can register here.

Hope to see many of you in Brussels!

About OSGeoDevEvening:
OSGeoDevEvening is an event where developers / researchers can learn & speak about a specific tech. We are always looking for speakers for the next events, so if you want to give a presentation about R, grass, QGIS, PostGIS... please contact us.

Tuesday, February 2, 2016

Report of Geospatial@FOSDEM 2016


Last Sunday, during FOSDEM the second edition of the geospatial devroom was happening.
As said before we had a nice lineup with 15 presentations with topics ranging from established GIS tools, Open Streetmap, 3D visualisation and spatial databases.

Anyway, I did the first presentation on SAGA GIS, and I was happy to have some very nice slides prepared by other members of the SAGA community.
Next up was Hugo Mercier (Oslandia) who presented Tempus. Planning multimodal transportation is a very hard problem, and it was nice to see that you can actually get the sources of the whole project. Next up was Astrid Emde presenting Mapbender, an OSGeo project allowing one to create web SDI's easily.
The next talk by Zeeshan Ali, "Build a geo-aware OS" was one where I was looking forward to : the talk is not one you usually encounter during FOSS4G conferences, but an example of the crosspolination of technologies you get at FOSDEM. It shows how location can now be used in Gnome (and other projects building on FreeDesktop) using common API's.
Getting ready to add location using a raspberry zero

Next up we got a full room for the presentation of Margherita Di Leo and Anne Ghisla presenting the results of the Google Summer of code projects coached at OSGeo.
This is how we like our devroom: full!


Everything got even more crowded for the next talk by Tuukka Hastrup on open journey planning. As people kept trying to enter our room even though it was full, I decided to play doorkeeper and missed the actual talk. 


For those who don't get it "FULL", stop entering!
But based on the feedback and the slides, I'm really looking forward to the video of the talk.
Still in a crowded room Ilya Zverev gave a talk about mapping with OSM with a phone . Rather than mapping using satellite imagery, it makes more sense to map when you are actually in the field.


The next talks were all focused on 3D. Thomas Bremer talked about how one could implement a flight simulator in javascript. He focused on the different components that could build such a simulator. I hope to see a demo of this soon. The next talk was on the integration of Openlayers and Cesium. I missed the talk myself (one has to get lunch at one point), but I got some nice feedback. The last talk in our 3D theme was Vincent Mora on iTowns, showing impressive Lidar scans of large parts of Paris. Even though many of us are still struggling with 2D, a lot of data collection is now 3D and I think GIS systems still have to catch up.

The next block of four presentations were all on databases. Starting of with MySQL GIS. I was pleasantly suprised by the presentation. MySQL and Oracle got some bad press in some open source communities, but I believe the way they are working on MySQL is examplary: not only is MySQL catching up quickly with other (spatial) databases, this is largely done by improving the underlying boost geometry library, which can be leveraged by other projects. Oracle is currently sponsoring 2 developers on that project.
Also Rasdaman, a raster array database extension for PostgreSQL was presented. Even though their use cases may currently be 'far from the bed' of many developers, I like the fact that they are not only implementing a product, but also shaping the standards (OGC and ISO) on the way. 
The third presentation focused on the geographical capabilities of a completely different type of database: mongoDB. I see a lot of possibilities of this database for geodata which is not as structured as classic databases. Nice to see their performance is improving.
The last presentation in the on pivotal Greenplum database was sometimes hard to follow, but I will definitely check it out further: I was not aware of the database, but it is a parallel database based on Postgresql, meaning that postgis functionality can be used, but also the extensions for trajectory data which were the topic of the presentation.

Closing the devroom was a presentation on geocoding by Ervin Ruci, which is a topic where the performance of open solutions can still be improved a lot.


At the end of the day, the closing keynote of FOSDEM, which was given by the people of HOT OSM. A full Janson is always something special, and this is definitely true for a topic of a talk I'm so familiar with.


Closing Keynote about Humanitarian Openstreetmap

To conclude, I believe the devroom at FOSDEM was a great event, and I really think it has its special role compared to other events such as FOSS4G and State of the Map - the chance to meet other open source communities.

Videos of the day should be available soon, thanks to the incredible FOSDEM video team and Anne Ghisla and Thomas Gratier who helped with the camera/organisation.